One Year of Lopaka: Analytics, Growth, and Gratitude
General ·Year in Analytics
In December 2022 (over a year ago) the first version of Lopaka appeared. Or rather, a rough draft of an editor that only worked with the Flipper API. Around May I set up a dashboard in Airtable to monitor the growth of my Twitter, Telegram, and GitHub. The lopaka.app launch was in June 2023. That’s roughly when I started collecting DATA.
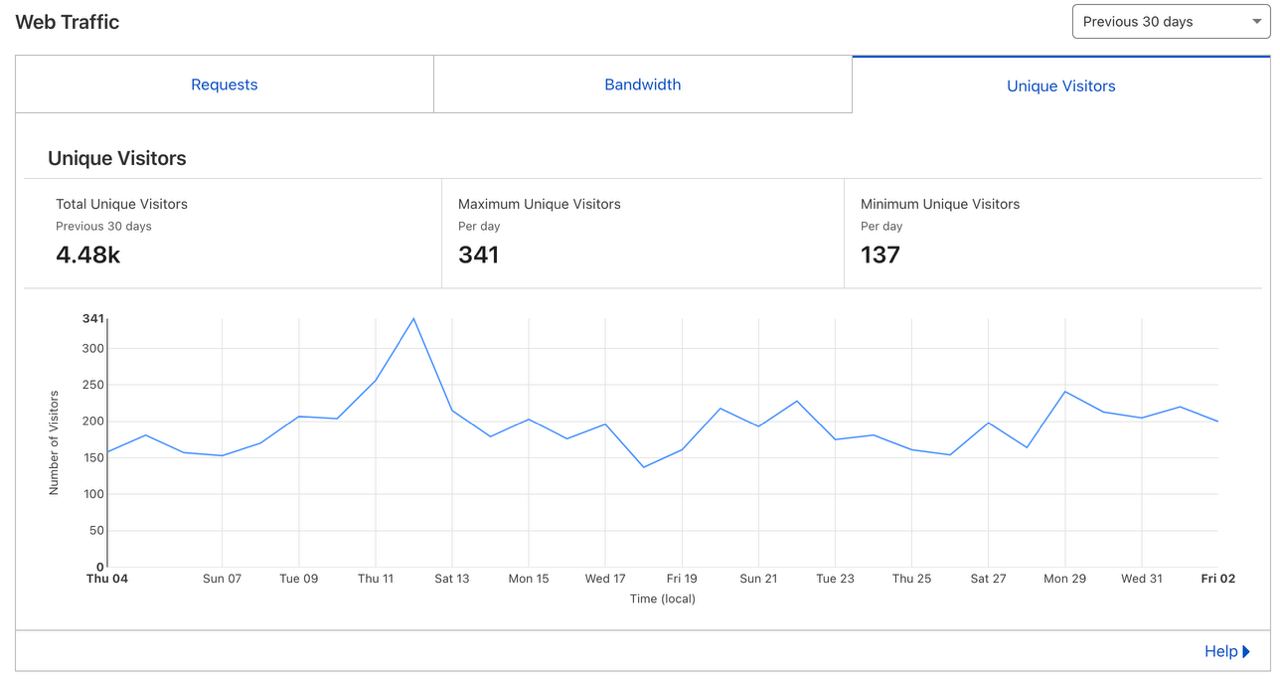
Let’s go in order: the very first version was published on my site, and it’s still there: https://ilin.pt/stuff/fui-editor/ (you can compare before-and-after). I checked analytics through cloudflare.com — they show the number of unique users over the last month. An excellent free option for starters. Though I have a feeling that a noticeable chunk of traffic is bots, because Google’s numbers are noticeably different. Any idea why?
After the June launch I set up Google Analytics and started watching 👀
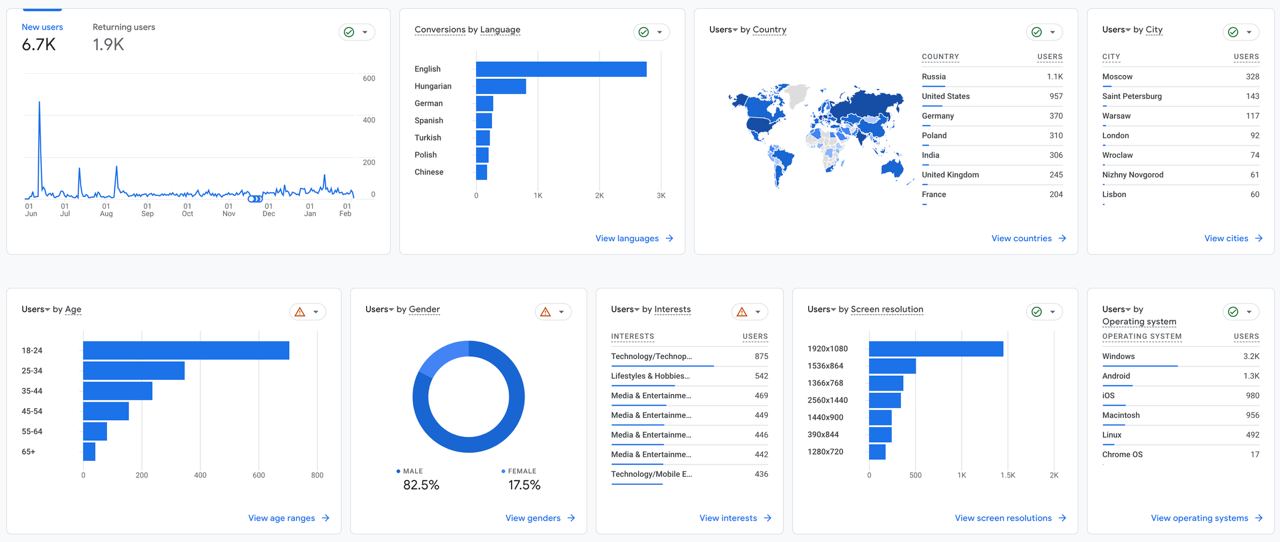
The first big spike on the graph is the day of the major announcement with a bunch of reposts. It’s hard to see, but monthly traffic doubled over six months! It’s incredibly exciting to watch people from all over the world visit your site, actually use it, and come back again and again.
I also set up Events to see which buttons people press, which tools they use, and which screen sizes and libraries they choose. The most popular tools are SELECT, LINE, STRING. The most popular canvas zoom is 100%. People want to see the design as close to the real display as possible. The AdafruitGFX library overtook U8g2 in popularity.
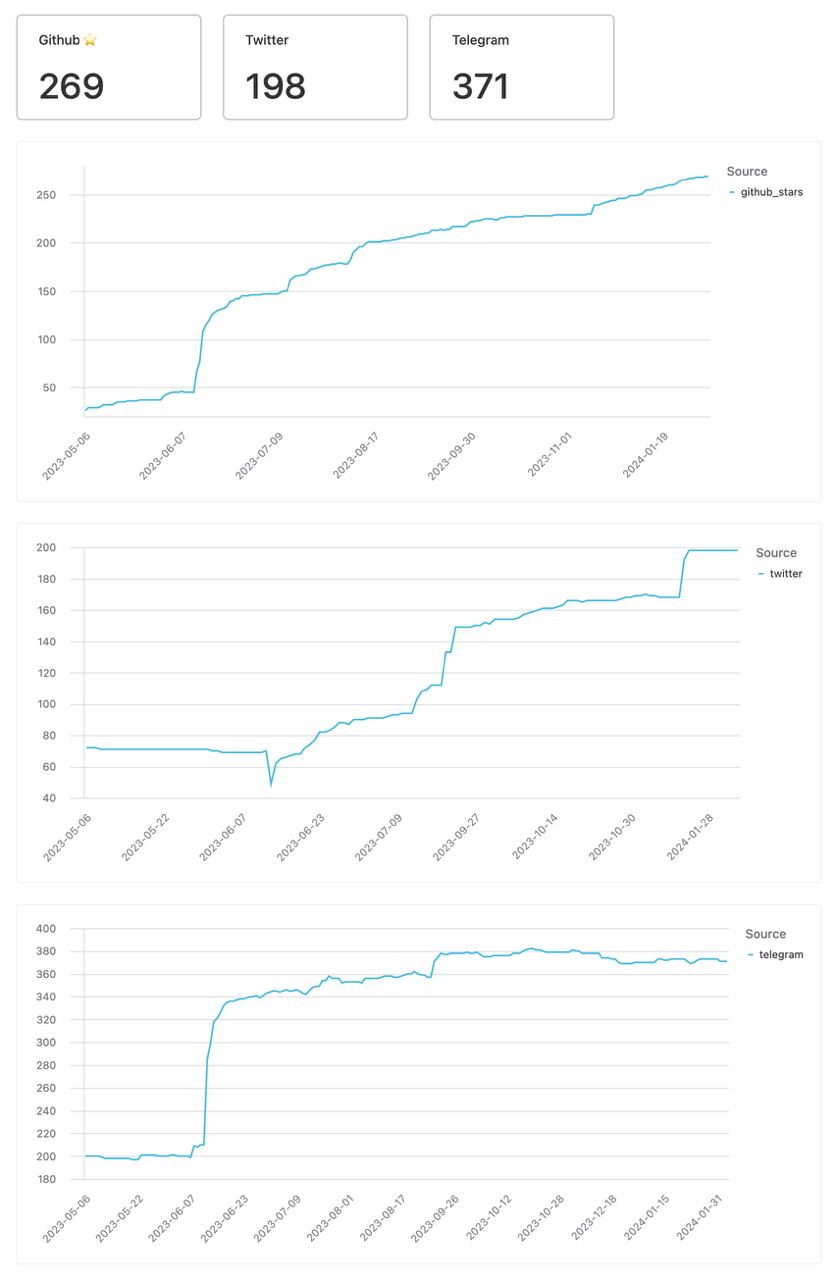
Airtable.com lets you build interfaces for displaying data. First thing I started collecting there were marketing metrics: subscriber count, followers, GitHub stars. All of this runs automatically through an n8n.io flow that launches every day and makes API requests.
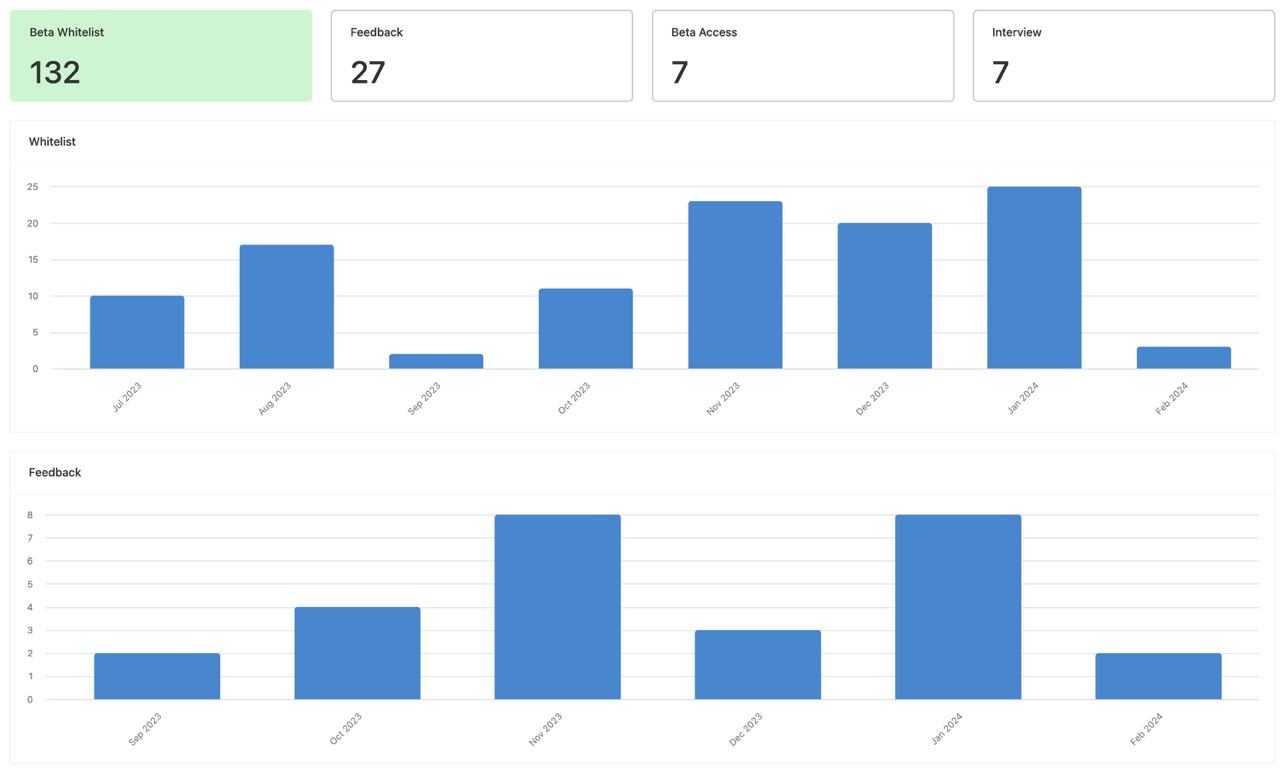
Then I set up graphs for beta signup and feedback forms. There I also display numbers for how many users signed up for the beta and how many interviews I conducted. Submissions land in Airtable, where for each record I check boxes with status: interview, invite, etc.
There were also experiments with openreplay.com — it’s an analog of Yandex Webvisor. And it’s paid. It’s fun to watch users, but not very useful so far.
Results are very positive:
Over six months we grew from zero to several thousand monthly users. Beta signup numbers are growing. February feedback is already almost catching up to December numbers. Real contributors started appearing on GitHub: people writing code, drawing icons, creating issues! I’m very pleased.
And we continue actively working together with Denis @deadlink. Without him the project wouldn’t have grown this cool and this fast. THANK YOU.
My social media activities finally yielded some visible results. Over the last month I got about 20,000 views total (seems like small potatoes, but for this project those are serious numbers). And people are still coming from this Wojciech video.
If you’re interested, follow our Instagram https://www.instagram.com/lopaka_app Our Twitter https://twitter.com/lopaka_app My YouTube https://www.youtube.com/channel/UCCkpvBeKwMAjc-mwGLuzNnA My TikTok https://www.tiktok.com/@ilin.pt (warning: lots of trash content and experiments)
P.S.: feedback we’ve received:
Wow! To sum it up in one word, WOW! Thank you for your work, effort, and passion in creating this application. What a joy it was to stumble onto it and use it. I’m mostly a hobby user with a passion for microcontrollers and sensors, but it has also crossed over into my day to day work life where I work manufacturing custom HVAC equipment. Thank you for creating this.